[Loki] 로키 관련 내용 정리

사내에서 현재 사용중인 Grafana사에서 개발한 Loki에 대해서 내용을 정리해보려고한다. loki의 architecture는 친절하게 아래 페이지에서 확인이 가능하다.
https://grafana.com/docs/loki/latest/get-started/architecture/
Loki architecture | Grafana Loki documentation
Loki architecture Grafana Loki has a microservices-based architecture and is designed to run as a horizontally scalable, distributed system. The system has multiple components that can run separately and in parallel. The Grafana Loki design compiles the co
grafana.com
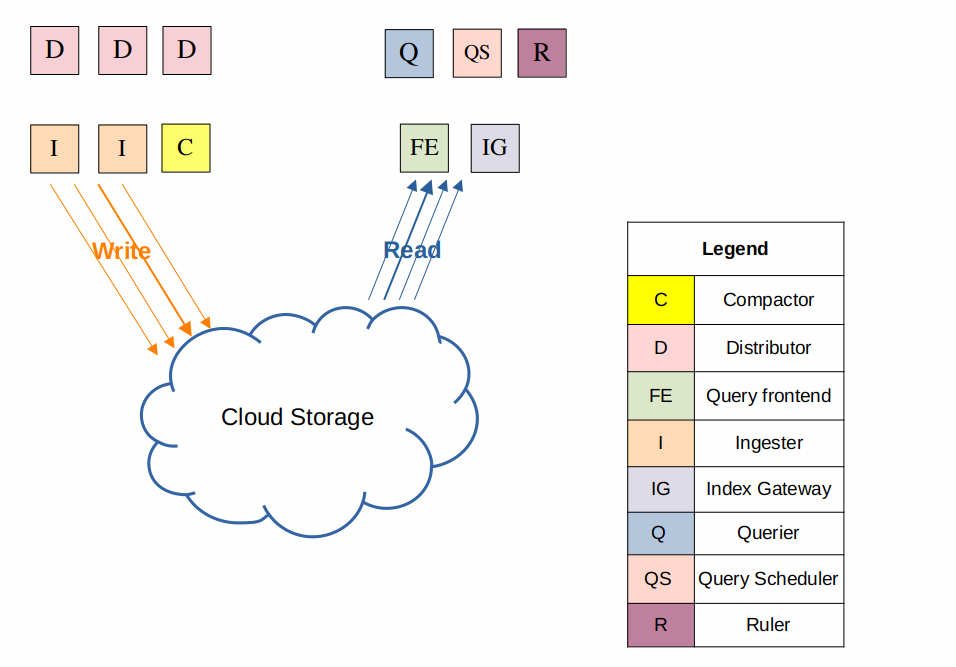
간단하게 설명을 하자면. 아래와같은 요소로 나뉘어져있고 역할은 다음과같다.
- ingester - distributor에서 보낸 로그 정보를 받고 캐시 저장, 압축 처리, WAL(Write Ahead Log) 를 작성하여 재시작 시 로그 유실 방지.
- distributor - 로그 수신자 역할을 하고있고. 수신한 로그에 대해서 ingester 노드에 전송함
- query frontend - 쿼리 최적화 및 캐싱. 쿼리 성능 개선의 핵심 컴포넌트
- query - 사용자 쿼리를 받아서 ingester에는 최신 로그 검색 & Object Storage 에서 오래된 로그 조회
- compactor - 오래된 로그 블록을 머지해서 디스크 용량 절약 및 인덱스를 압축하여 조회 성능 및 저장 효율 향상. 오래된 데이터에 대한 삭제 설정도 해당 컴포넌트에서 이뤄짐. 주로 Object Storage상의 데이터에서 작동
- ruler - 로그 기반 Alert Rule
- canary - Loki 자체 헬스 체크 + 테스트용 컴포넌트
loki를 배포할때 3가지 모드가 존재한다. 이 모드 설정은 Loki helm chart의 values.yaml(deploymentMode)에서도 볼 수가 있다.
- Monolithic Mode - 아래이미지와 같이 위에서 설명한 모든 요소들이 한개의 바이너리에 포함되어있는 형태를 가진 모드이다.

- Simple Scalabel Mode
- 위에서 설명한 요소들중 유사한 컴포넌트끼리 묶여있는 모드이다. 문서상 하루에 1TB/day 내로 발생하는 로그 시스템에서 추천하는 모드이다.
- Write - Distributor, Ingestor
- Read - Query Frontend, Query
- Backend - Compactor
- 위에서 설명한 요소들중 유사한 컴포넌트끼리 묶여있는 모드이다. 문서상 하루에 1TB/day 내로 발생하는 로그 시스템에서 추천하는 모드이다.

- Microservices Mode
- 위에서 설명한 컴포넌트들이 각각 관리할수있게되는 모드이다.
위에서 설명한 모드에 대한 내용은 아래 페이지에서 확인이 가능하다.
https://grafana.com/docs/loki/latest/get-started/deployment-modes/
Loki deployment modes | Grafana Loki documentation
Loki deployment modes Loki is a distributed system consisting of many microservices. It also has a unique build model where all of those microservices exist within the same binary. You can configure the behavior of the single binary with the -target comman
grafana.com